With a name like Branson one wouldn’t suppose that I was all
that Irish but my dad said those three generations of Branson’s married women
with substantial Irish blood. My dad,
brother and sister all had red hair. I
was a toe-head…same color in retirement as it was when I was born. So I have an underlying interest in
Newgrange. It is far from what mainstream science thinks it is.
The image below is a portion of the entrance stone at the
entrance of the Newgrange archeological site.
This is an amazing image. A
photograph from the website of https://www.newgrange.com/
under Kerbstones, #1 from the collection of Prof. O’Kelly is used in the
background imported into ACAD products and carefully marked with great
precision. The image is
“self-deciphering” or one could never attain the required precision from a
simple photograph. And it helped that the lines were drawn in the right
direction or else the azimuths would have been off by 180 degrees and not so
easily discovered.
One can imagine that this stone was moved many times during
the reconstruction process that took years and since it is now sitting on a
prepared surface it is certain to have been moved. Whoever took the picture may have used a
tripod with leveling screws or just taken a standard off-hand alignment. In any event, it ended up pretty close, but
not precise. However, the image is self-aligning, using the easily measured angles
secondarily as the azimuths of the lines in all cases. Actually, the azimuths
play no role in the modeling that is developed herein, just the angles.

The lines and end circles were “grouped” together with the
image and rotated a few hundredths of a degree ccw to align the 76.1445731
angle and azimuth. That then made the
horizontal line exactly azimuth = 0 or 360 degrees (std in CAD packages). That made the top left blue line aligned at
an azimuth equal to the top angle of 9.9067947. The other azimuths are
represented by adding multiple angles as shown in cyan and yellow.
The two azimuths in green are related to each other by the
formula
(x = y^3 x 25 where y is
172.88264 / 100 and x=129.17967
The ACAD 8 digit precise line lengths were entered into a
Mathcad 15 digit precise model and the whole affair set up to make hundreds of
calculations easily. The image below
taken from the Mathcad model shows the ACAD data stayed intact and the
precision was expanded. The purpose of
this exercise was to see if there were “checksums” that proved design intent
and not some super complex accident.
The ACAD perimeter numbers were labeled h1, h2, h3 and h4
and are set into the model as initial guesses to check for minimal error
(MinErr function). Since a symbolic
exact solution was not found, the MinErr results were repeatedly set back into
the initial assumptions until the output converged on precise values.
The product of the horizontal distance of “y” times a
scale-up factor “z” was set to make the product = phi squared x 10 =
26.18033989. The idea was to find some
distance that more closely matched the actual distance on the stone, still
unknown.
The distance “y” is calculated two different ways using
trigonometry from the triangles. There is no line for the vertical distance “x”
but it was measured carefully in ACAD.
Again two different methods were used to calculate the same distance.
Down at the end marked in yellow shading are the sums of all
the dimensionless ratios of the four perimeter numbers. If the design intended to indicate when the
proper numbers had been found, it was thought these ratios might be one method that
would be used.
One can see the sum closely matches the ratio of (e-1) =
1.718281828 divided by the feet to meter conversion of .304792. (discussed
further below). The blog on Tibet discusses
this conversion in more detail, the title listed at the end of this blog.
Highlighted in green is the dimensionless ratio
of sums of three sides that very precisely fit the ratio of 105 / 99 which has
34 as the conjugate ratio. There will be
more on that later.
The Mathcad model only changed digits beyond the precision
level set in ACAD. The original ACAD
numbers are shown numerically (h1=1.3918459) and underlined in red. The Mathcad model did not change anything
except making the “checksums” more convincing.
As comprehensive as this may seem, it is only the tip of the iceberg to
come.
The image below shows that the entrance stone spirals are
not just made by some ancient dude having too much to drink around the
campfire. The curves are very complex
and even too much for ACAD to handle efficiently. Fortunately, the bulk of the curves fit to a
series of circles and the connecting lines can be thought of as involutes. In the upper left, the green dashed circles
are nearly concentric but purposefully not quite. The centers of the circles create the solid
green line as is done in all the concentric circles on other spirals. The green circles are connected by arcs in
yellow dash and these are at definite angles such as 90, 16.3627((2.5 phi) squared)
and 28.408115 (1.420405751 x 20) where the hydrogen hyperfine frequency is
used. These lines were originally drawn
to about 4 places precision having no idea what it might mean. Later they were
then adjusted for the precision to see if they still fit. The reader can decide.

Prior to this analysis one would think the spirals were
something the campfire dudes thought were magic or spiritual and likely
developed by some Ancient Irish dude with too much to drink. They are not.
They are something very precise and deeply mathematical and too complex
to describe in a single image.
Here is just one example.
In the center of the blue spirals is a yellow triangle. Nobody could
draw this triangle with precision developed herein but in this case it got
close enough to suggest a trial. The
azimuth of the left side was about 62.13 degrees and the azimuth of the right
side was double that such that with the bottom horizontal, the left and top
angles were each 62.13 deg. The
reciprocal of the mile to kilometer conversion 1.609344 is .62137113 and that
is developed from the basic meter to foot conversion of .3047997 as was in use
up to 1959 when some witch doctors got together and formally established it at
.3048. In my high school Handbook of
Chemistry and Physics (1958-1959 edition) it is still shown at .3047997 which
would make the kilometer to mile conversion at .6213718. The mathematical model is probably too
complex for the interest of most readers and is left for the appendix.
One other simple example of modeling developed from the 97
Kerbstones. Check out the following
calculation starting with the gravitational constant with decimal shifted.
(17202.09895
* 5)^(1/2) * 2 * 97 = 56,895.43901 is the area of the structure
(56,895.43901
/ pi)^(1/2) * 2 = 269.149629 =average diameter of the structure
The diameter
* pi = 845.5584973 ft = circumference (checks with Google path)
(
(Circumference) / 97 )^(1/4) = 1.718276225 where (e-1) =
1.71828
It appears like the builders wanted to hide some aspects from
aerial view of what the structure was all about by burying the large Kerbstones,
more or less like Gobekli Tepe. (referenced at end of this blog)
The image below is a composite of images from Wikipedia
“Fermat’s spiral” and a portion of the Newgrange Entrance Stone shown above
without the ACAD marks and some new marks for this image. The key to Fermat’s Spiral is the “Golden
Angle” 137.507764 which is derived by dividing 360 degrees by phi squared =
2.618033989. There are many lines on the stone at this azimuth; two are marked
in thick yellow lines.
At the bottom right an attempt was made to trace the spiral
using the multiplex line function in parallel blue and red curves to enhance
the view symbolically and not a major precise sketch. A few lines of the potential 6 degree
overlapping grid shows how the data would be extracted for the equation r = +/-
Ø^(1/2) .

In the simple modern Fermat Spiral, the parabola is very
simple and precise. That is not what
comets and other orbiting bodies follow.
They pass by other planets, Oort Cloud objects and Kuiper Belt objects.
There are many who think the only thing Newgrange has in
common with Stonehenge is the use of the solstice….winter in Newgrange and
summer in Stonehenge. The fact is
neither having anything to do with the solstice. If one had been inside Newgrange around
December 18th, 1680 it would have been clear what the purpose of
each monument was. The proof of that
starts here with Newgrange and continues on with the Stonehenge website.
The background image below is from Wikipedia and
is originally from the work of William Frederick Wakeman back around 1900 AD. I
have his book electronically. Be sure to check out the fine print between the
views.
One can see there is more to this diagram than typically is attributed.
Below in the Mathcad model one can see these assumptions are put into the
lengths of c1 = 19.5 and c2 = 6.5 and c3 was calculated using only phi squared
and the reciprocal of phi (called phi2 here because Mathcad has already allocated
the name phi to something more complex).
The model numbers are so close to the Wakeman
numbers to not be measurably different even with modern equipment and it is not
likely that the structure could be built with that level of precision by
anybody. The Wakeman data simply suggests the modelling
assumptions. Obviously Wakeman had some
reason for putting down the numbers that he did. It is up to the results, however, to stand
for themselves.
In the green underlined assumption, the number 1.495979855
(discussed above and in the appendix below) is an independent number that is at
times the earth/sun digits of distance in kilometers at great precision. The blue assumption uses the universal
gravitation constant of G= .01720209895 often referred to as the Newton’s
Constant or Cavendish’s constant. In most cases the original Wakeman data
suggests these numbers to about 5 digits of precision. The chances of this happening by accident or
by Wakeman are about equal to a snowbird surviving in hell. J
For this model to nest together in so much redundancy is a certainty that the
builders wanted it that way. What follows proves it beyond any doubt.
The image below from
Prof. O’Kelly book “Newgrange” imported into ACAD demonstrates that the
builders knew what the maximum earth axis tilt would be and also how much
variation there would be at about 2.4 degrees as shown by A.L. Berger in his
5,000,000 year graph in Wikipedia under the appendix “obliquity” and “axial
tilt” below.
In red marked west and
east view pinch points, one sees the cyan line is as far east as the sun can
shine thru to the back and the dashed red as far west at the back. Left Stone 17 is the pivot point for both
lines and the angle is 2.4 degrees which is what the earth axis tilt varies over
20,000 years discussed later under obliquity.
The reader might wonder
how the ancients could know so much about earth which can only be “measured” by
data spanning 41,000 years. Modern day
computers can easily make the calculation using thousands of data points from
the JPL DE200 archives; however what causes it, is unknown to science until
now. The small insert shows a photo looking out the entrance and slit at the
Great Circle Stone No.1. The slit width
distance required for 2.4 degrees center to center is a little over half a
meter but using the full sun diameter yields much closer to the 1 meter the
slit actually is in width. The sun
diameter fits the height of the slit quite well. However, the slit is not designed exclusively
for the sun, to be discussed later.

Apparently O’Kelly lost
ten feet in his measurements on the north (left) end. It appears the measurement by Wakeman 19.5
feet was used for the drawing by O’Kelly as 9.5 feet. Fortunately, O’Kelly got the same 63 feet
passage length and 21 feet for the crossing chamber. Wakeman numbers are approximated in cyan on
the image above. Using O’Kelly’s
photographs, it is clear the end chamber is about 10 feet longer than the
measurements his drafter used. In order
to make the stone widths fit, the drafter had to scrunch up the large stones,
some were turned steeper angles and even shown narrower than they are in
reality. Someone who has access to
Newgrange can easily pace off the distance in 1 meter steps to see the overall
length should be 27 meters (89 feet), not 24 m (79 feet). Fortunately, all the
important data to follow is in the first 63 feet.
In the plan view above one can see that both the right and
left side passage stones are not placed in a straight line, but in nested large
arcs of circles. The red and blue
circles are drawn 48.275 and 49.19876 feet in radius. These numbers combine to
create hydrogen most abundant wavelength of 1.215668 and hydrogen hyperfine
wavelength of 211.06114. These numbers
are part of a puzzle solution and a further indication of a complex design
plan. Sirius B dark star companion to
Sirius A emits hydrogen frequencies and it is fairly common for white dwarfs to
emit hydrogen frequencies. This will be discussed later.
The radius 48.275 feet squared is the radius of the earth
from the axis measured horizontal out to Newgrange in miles. Both the maximum tilt (cyan line) at 24.5
degrees and the minimum tilt (red dash)
at 22.1 are forced to pass over stone L17 on the west side where the
blue circle passes. At maximum tilt the
sunlight also passes over the L7 stone where the large circle passes. This may indicate the potential cause of the
fluctuation in the earth axial tilt. The stones placed on their arc make this mathematical
analysis possible.
On the right side of the section image above in dashed
circles (entrance to Newgrange) the red and blue dashed circles are drawn 87.645
and 88.0388 feet in radius and are linked to the left circles by the number
.3937, the conversion for centimeters to inches. What better way would there be to catch our
attention.
In one of the Star Trek episodes called “Paradise Syndrome”
the star ship approaches a planet and notes a comet baring down which will
destroy the planet. Captain Kirk beams
down and finds something similar to Native American Indians living there but a
huge stone structure definitely not made by the Indians. Thru great fortune, he calls up to the ship
“Captain Kirk to Enterprise” and those words cause a door to open and he falls
inside. Inside are large computers and
lasers. To make a long story short,
eventually Spock figures it out and gets the lasers going and they destroy the
incoming comet, something Enterprise purportedly could not have done.
What is being presented herein is a theory that Newgrange,
while no computers or lasers, is just that type of device designed to at least
warn earthlings of a coming major catastrophe, soon to be explained herein. But first, here are some pertinent details
about Newgrange.
Wakeman, and perhaps many, called the first 63 feet the
“passage” as if it were the simple access to the chamber thought to be a
tomb. It is not.
Being raised around an underground gold mine, the timbering
required to simply hold up loose muck was a well-defined science even hundreds
of years ago. Nobody in their right mind
would construct a passage using the huge stones and complex cover stone
configuration to simply hold up the muck.
The section views drawn by O’Kelly indicate there is substantial
connectivity between the passage trilithons and the stones above them,
particular back in the chamber area. However, there are no detail measurements
of the stones above the passage, so anything we are to learn must come from the
wall stones. Typical construction of a tunnel would be much smaller stones laid
parallel to the tunnel and then a simple arch connecting the sides.
The analysis of the passage stones is both extremely simple
and immensely complex. In the section
view above, the stone widths at the floor of the passage were drawn in green
and also entered into a computer spreadsheet.
Most people would think the widths would vary randomly simply because
that is what stones were found to be most available. That is definitely not the case.
Below in light blue is the simple graph of the stone widths
at floor level starting at the entrance and progressing to stone R21 on the
east side. If these were random stones,
then the plot of the widths should be random in the plot. One can easily see there is not a single
stone that isn’t connected to at least two other stones graphically shown in
dark blue dash. There are actually
enough equations to create a mathematical model of the stone widths and gaps.
The widths are additive in basic nature. This number can be mathematically operated to
fit standard numbers if it is actually possible. As if to train us what to look for, the sum
of the first three stones is 9.791865898 and that multiplied by 0.7 (7
equations) and then taken to the 1/4th root yields 1.618046 compared
to phi = 1.618034. If that were the only
statistically significant event, it might be thought to be an accident. In reality, there are too many significant
events to even list them all in a simple report. And of major interest to this report is the
dozens of occurrences of hydrogen wavelengths and frequencies in the equations.
It seems unlikely any modern day human could
even create this mathematical model, let alone provide the solution. In fact,
it could be more sophisticated than an advanced alien civilization could
create. Measuring is one thing, placing
them is something else. Then to have
O’Kelly take some type of measurement and then the drafter place them on a
sheet collectively seems impossible. But
it turns out to be quite simple.
Another graph in dashed green was made by simply plotting
the dimensionless ratio of the first stone divided by the second, second by the
third, etc for all 21 stones. There are
eight potential equations linking all 21 stones shown in black. There now are more than sufficient equations
to solve for all stone widths precisely even though they cannot be measured or
recorded that precisely. They are now a
mathematical model.
The starting point at the entrance is fairly easy to
define. The ending point at R21 north
edge is sloping in two planes and highly questionable where the 63 foot length
is concluded. What makes things simple
is that the sum of the stone widths and gaps has to be somewhere near 63
feet. If a stone width is marked and
measured short, the gaps will be correspondingly longer. Since the graphs are not nearly as precise as
the actual data, the graphs smooth off the peaks and valleys and make them
appear somewhat precisely connected.
One could not fudge the numbers. The only way to draw the “connections” is to
start with the graph output. But one
does not know how the sum is behaving and one could end up with the sum
substantially different than 63 feet. Therefore, the graphs are a superb
indication of design intent. A third
graph not included is of the gaps and they also show the same type of
connectivity.
Are large dashed entrance circles indicating in distance something
of extreme importance? Could it be
possible that this geometry relates not only to the fluctuating earth axial
tilt but also to what causes earth axial tilt to fluctuate? That will be examined far below.
Newgrange Related to Stonehenge?
The two images below are from Google Earth regarding
Newgrange and Stonehenge. The white
lines lower left develop from the “path” option of the GE ruler which
accumulates distances even if you repeat part of your path. To make this image, one starts with the 63 ft
distance from the mouth proceeding inside, then continuing on 6.5 ft to the
cross chamber, then a near right turn out to the NE end 6.0 feet and 7.75 feet,
then back to SW end retracing the 7.75, 6.0 and 7.25 on the left side, then
back to center and then continue to far NW end the 19.5 ft as measured by
Wakeman. In so making that trek, the
cross chamber is entered into the path twice.
Using that type of path summation resulted in a total of phi^2
x 50 = 130.9 feet. That relationship
wasn’t used in the model because it wasn’t discovered until the image below was
created. What else might there be?

The yellow line in the image represents the distance and
azimuth from the center of Stonehenge (which was not marked by anyone until
now) to Newgrange. The distance is quite
precisely (22/7 E16)^(1/2) /128 = 1,385,008.22 feet where 128 is 2
raised to the seventh power, something often seen in this type of ancient analysis. The azimuth from Newgrange toward Stonehenge
is 133.4256 or as the reverse shown in the image that number plus 180 at 313.42
degrees. The number 133.42 can come from
400/2.99792458 where the latter is the speed of light constant but developed
from other common numbers having nothing to do with the actual speed of light. There will be many who will want to argue
that this is all coincidental, but in my opinion those thoughts only deprive people
from the real beauty of these monuments.
Newgrange could have been placed anywhere in the area and still aligned
with the solstice, but it was very carefully designed for where it is.
The ratio of the Newgrange latitude at the entrance to its
longitude is 8.292283912 which when the longitude is used at -6.475236 the
absolute value (drop the negative sign) of the latitude is 53.69449531 which
checks out quite precisely. The 8.29
number derives from musical middle “A” at 440cps divided by 8 octaves = 1.71875
cps, a very inaudible low note “A” but a popular rhythm. The exact formula is
{[(1.71875^5)*8/100]^4}*4 =8.292283912 where 1.71875 was
mentioned above.
These are all signs that something very profound is going on
at Newgrange. But even I wasn’t prepared
for what follows with the analysis on the spiral image from inside the
passages. This may be a little complex
for most readers so you may want to ask for help from a local engineer or
professor.
The background image below is probably originally from
BoyneValleyTours.com though that is not where I found it and is one example of
many images like it on the internet. The
green triangle uses the center of each spiral carefully positioned in ACAD
products. The lines, angles and circles
are extremely precise. The reader must
decide if they fit the image appropriately. The lower green dashed line is
161.66 degrees from zero at due east or due horizontal to the right side.
(typical of most CAD system standards).
This was close enough to 100 phi =161.8033989 that one could be tempted
to make it that angle. That would have
been a big mistake.
If you had been in the Newgrange tunnel towards the back in
most of December 1680, just as soon as the sun went down you would have been
able to see Comet 1680. It has residual heat
of its own and doesn’t need the sun to be visible….but….it gets a lot more
visible after coming around the sun at close range. That means the outgoing Comet would be very
bright and clearly visible well into January 1681. It seems likely that Newgrange has various
spirals and other marks that indicate where Comet 1680 is in its progression
towards an earth axis obliquity reversal. It could be that a crystal or prism
located at the cross-cut tunnel bent weak rays to almost right angles and made
light on spirals in the otherwise dark caverns. The reason for the upper
chamber could be to measure the tilt to the solar plane as the outgoing
trajectory with more precision. A modern
examination of these areas might be fruitful.
Any crystal or reflective stone would likely be stolen with the initial
entering of people unknowing of the true purpose of Newgrange. The marks on the
walls probably explain how it works with dimensionless ratios.
One has to imagine that for the earth to slow its huge but
slow angular tilt, stop and then reverse relatively suddenly, major upheavals
are going to be happening. It could be
this period is so disruptive at times that any advanced civilization living
here would pick up and go somewhere else if they could. If it triggers super volcanoes like
Yellowstone, it might be 1000s of years before things settle down and become
the place we have loved peacefully for the last 10,000 years. If humans need a
beautiful but challenging environment, earth may just be the “cat’s meow”…..for
a while.
It is interesting the Berger’s 1850 basis fits well into the
theory that the last reversal was around 8104 BC and the next one will be about
twice that time into the future or around 11,850 CE. It also seems likely that the greater effect
on earth is at the maximum tilt rather than the next minimum tilt.
End of 4-17-2019 update
One other simple example of modeling developed from the 97
Kerbstones. Check out the following
calculation starting with the gravitational constant with decimal shifted.
(17202.09895
* 5)^(1/2) * 2 * 97 = 56,895.43901 is the area of the structure
(56,895.43901
/ pi)^(1/2) * 2 = 269.149629 =average diameter of the structure
The diameter
* pi = 845.5584973 ft = circumference (checks with Google path)
(
(Circumference) / 97 )^(1/4) = 1.718276225 where (e-1) =
1.71828
It appears like the builders wanted to hide some aspects from
aerial view of what the structure was all about by burying the large Kerbstones,
more or less like Gobekli Tepe. (reference at end of this blog)
There are many who think the only thing Newgrange has in
common with Stonehenge is the use of the solstice….winter in Newgrange and
summer in Stonehenge. The fact is
neither having anything to do with the solstice. If one had been inside Newgrange around
December 18th, 1680 it would have been clear what the purpose of
each monument was. The proof of that
starts here with Newgrange and continues on with the Stonehenge website.
The yellow line in the image represents the distance and
azimuth from the center of Stonehenge (which was not marked by anyone until
now) to Newgrange. The distance is quite
precisely (22/7 E16)^(1/2) /128 = 1,385,008.22 feet where 128 is 2
raised to the seventh power, something often seen in this type of ancient analysis. The azimuth from Newgrange toward Stonehenge
is 133.4256 or as the reverse shown in the image that number plus 180 at 313.42
degrees. The number 133.42 can come from
400/2.99792458 where the latter is the speed of light constant but developed
from other common numbers having nothing to do with the actual speed of light. There will be many who will want to argue
that this is all coincidental, but in my opinion those thoughts only deprive people
from the real beauty of these monuments.
Newgrange could have been placed anywhere in the area and still aligned
with the solstice, but it was very carefully designed for where it is.
The ratio of the Newgrange latitude at the entrance to its
longitude is 8.292283912 which when the longitude is used at -6.475236 the
absolute value (drop the negative sign) of the latitude is 53.69449531 which
checks out quite precisely. The 8.29
number derives from musical middle “A” at 440cps divided by 8 octaves = 1.71875
cps, a very inaudible low note “A” but a popular rhythm. The exact formula is
{[(1.71875^5)*8/100]^4}*4 =8.292283912 where 1.71875 was
mentioned above.
These are all signs that something very profound is going on
at Newgrange. But even I wasn’t prepared
for what follows with the analysis on the spiral image from inside the
passages. This may be a little complex
for most readers so you may want to ask for help from a local engineer or
professor.
The background image below is probably originally from
BoyneValleyTours.com though that is not where I found it and is one example of
many images like it on the internet. The
green triangle uses the center of each spiral carefully positioned in ACAD
products. The lines, angles and circles
are extremely precise. The reader must
decide if they fit the image appropriately. The lower green dashed line is
161.66 degrees from zero at due east or due horizontal to the right side.
(typical of most CAD system standards).
This was close enough to 100 phi =161.8033989 that one could be tempted
to make it that angle. That would have
been a big mistake.

The angles in green were entered into a computer spreadsheet
and checked for relationships with each other in dimensionless ratios. The most
obvious relationship for a triangle is that the sum of the angles must equal
180 degrees. The second one was that the
dimensionless ratio of 64.415 / 37.277 was quite precisely 1.728 or 12 cubed
divided by 1000 where 12 is the conversion from feet to inches. The third
relationship divides 78.3076 / 64.415 = 1.215673 which is almost precisely the
second most abundant hydrogen frequency of 1.215674.

One can see that the precision of the Mathcad symbolic solution
(exact and not an approximation) was at least 15 digits. These values plugged back into the image
didn’t move the lines enough to see the movement even in ACAD.
Next the triangle leg lengths were copied into a spreadsheet
and the dimensionless ratio of each length to the other legs were checked in
the manner shown below.
1.404871
|
1.294086
|
0.8687477
|
|
1.404871
|
0.921143
|
0.618382718
|
|
1.294086
|
1.085608
|
0.671321406
|
|
0.868748
|
1.617122
|
1.489599
|
In the second column second from bottom, the 1.085608
repeated in numerous tries for a solution (p70 / p72 from the
spreadsheet). In the image below, the
sum of all three sides divided by the largest came out close to 2.54, the
conversion of centimeters to inches. (or 30.48 /12).
There was no symbolic exact solution and so the MinErr
function was used to find a very precise approximation. This methodology uses the initial data to
find a temporary solution, and then one substitutes that solution back into the
initial assumption. If a good solution
exists, it will gradually converge to where it does not change any more. By
changing the conversion to 30.479993 instead of 30.48, a good solution was
found. One must remember that a
committee changed the conversion from slightly below 30.48 to 30.48 apparently
for convenience. Not a good idea. Our
system of measuring units develops a fundamental relationship with how the
universe is put together and apparently sometime in the past at least somebody
knew that.
As the solution developed there gradually began
to develop the relationships in cyan and the other in yellow to where those
were made part of the model. In green
below is the Law of Cosines for the angles found above. 
Confirmation of the
model is a number of results that cannot all be accidents. Probably the most notable is the use of p72
in the ratio below:
(1/.76121942472)^(1 / .76121942472)^(1/2)*10/8
= 1.49534
The reader may remember
that this is the 4th root of 5 and has often been used in modeling
of these spirals.
Professor O’Kelly
remarks that the width of the triple spiral is about 30 centimeters but there
is no easy way to tell where he was measuring.
The task now is to find some type of system which indicates that the
model numbers translate into something real that can be measured.
The ACAD model shows
with great precision that the circumference of the green triangle is 17/9
squared or 3.56789001 which caught my attention. If one uses 21.10134728 / 2 (hyperfine
wavelength) as a scale factor to something close to real life, the large blue
dashed circle is 29.9792458 cm (speed of light) in diameter which is quite
close to 30 cm. For that trial
assumption to have legs, something else must result independently. Just as was seen at Stonehenge, the
difference between the upper green dashed line and the lower is 1.602176621^(1/3)=
1.170137228 (basic electric charge digits).
The ratio of the differences again is simply converted to another use of
the speed of light at 2.99791 thereby securing that it was done with design
intention. There is far too much data to include here and so some parts are put
into the appendix.
The Real Design
Intention of Newgrange
Now back to what all this
could mean and why Newgrange and Stonehenge have nothing to do with the
solstice by itself. If one had been
inside Newgrange on December 18, 1680 the great spectacle would have been observed. It is now called the Great Comet of 1680 and
was the first comet discovered with a telescope and observed over a month
before going around the sun as a sun grazer.
The paintings from around the world of that comet demonstrate a
monstrous sight with a huge tail and scary close flyby of the sun. If it hits the sun or anything in our solar
system in the future, say goodbye to all your relatives living at the time. You
can read all about the details on the blog regarding King Chamber and Arkaim at
the end of this blog. It is a little
tedious reading in the beginning because I didn’t have any idea where it was
going when I started but I wanted to leave the development path for others to
follow.
Newgrange is meant to
focus on the discovery of Comet 1680 when it approaches the sun from the
opposite side from the earth (winter solstice) where it can be easily
discovered because it is much more visible and for a much longer period of time. Stonehenge is meant to interact with the
comet in summer solstice when it passes
so close and quickly that it might not even be noticed unless the
gravitational field causes another “Noah’s Flood”. In the last such pass in about 1104 AD, there
were not that many people on earth and perhaps nearly none wherever it had the
most impact. However, the ancient
paintings on caves certainly indicate something very drastic has happened in different
places around the earth sometime in the distance past. It has been hounding us for millennia. There
is good evidence that Noah’s Flood actually did occur in 8104 BC during the
last axial reversal and it was a localized dropping of the crust below sea
level and not the rain that caused the localized flood and allowed the ark to
settle atop mountains near Mt Ararat before the mountains slowly rise back up
to their original elevation. The tectonic plate at Mt Ararat is relatively
small and could be kicked down from the flexing of the much larger plates of
Asia and Africa.
In the images to follow
from Hplanet software (John Walker ACAD developer), one must keep in mind that
it is impossible to draw the solar system on a scale unless the paper is the
size of a football field and the planets are pin pricks. The purpose here is to demonstrate how much
difference there will be in 2256 AD and 3407 AD.

In the Dec 18 1680 image
above, a scaled earth would be clear off the page top perhaps miles. The red ellipse shows the general path of the
comet and how the tail made the comet easily discovered. As the comet began to bend around the sun,
the tail would first grow longer and then appear to grow shorter and shorter
until the tail was essentially between the earth and sun. As it continued, the tail would appear to
grow longer and longer. The comet plane
is thought to be currently somewhere between 60 and 70 degrees tilt to the
plane of the solar system. That is how the perihelion could be determined and
thought to be Dec 18, 1680. That would make the comet appear to be closer to
earth than it really is in this 2 dimensional drawing. However, during axial
reversal, the comet may pass very near to earth on a much flatter angle. We have high hopes that the JPL folks now
talking about large Planet X disturbing bodies in the Oort Cloud and Kuiper
Belt is actually Comet 1680 on a highly elliptical orbit.
Note there are no large
planets in the pathway on its approach to the sun in 1680. Observers said it was so bright it could be
seen in daylight…meaning while looking at the sun, perhaps thru smoked glass or
equal. Paintings show the comet body to be about the size of the moon which is
also the size of the sun when viewed at their proper distances. Since the comet could never have been significantly
closer to earth than the sun, it must be really big (earth size at least) and
the tail even larger.
If this is a white dwarf
or dark star instead of a normal comet, the tail is permanent heavy particles and
is not being created by the sun boiling off water, but the direction of the
tail could be shifted by the solar mass ejections or magnetic fields. We don’t really know what the material is in
such a body, but it is thought to be very dense at perhaps tons per cubic centimeter. By passing so near the sun, the temperature
would rise very far and very fast. That is what makes it so important for Newgrange
and Stonehenge builders that knew more about it to try and warn us as far ahead
as possible. It isn’t going to be easy
to do something beneficial, if possible at all.
In the image below, one
gets a hint as to why it so much different for the next approach in 18-June of
2256 AD. The comet will pass near earth
both coming and going though not as bad as shown here out of scale. But anything that massive even passing by
quickly at a high rate of speed could send shock waves through the earth crust
and oceans. Note that Jupiter is also
pretty close and complicates the detailed calculation of what the trajectory
will actually be when it is finally discovered. If the entrance stone is trying
to say something with all the spirals relating to orbital mechanics, that could
be a solid basis for the carving.

In the image below for
the 18-June-3407 passing, one can see Jupiter might be really close to the
comet. A close passing could really be
disastrous for our solar system balance.
This is exactly what the message from www.arkaim-geometry.blogspot.com
is all about. It is an amazing second effort
by somebody to warn us. It may be
important that we develop relationships with advanced civilizations and try to
find somebody who can help us, if it is possible at all. This could be why we have so many visitors
and who don’t really want to get mixed up in something even they can’t do
anything about.

Maybe most people would
not be all that excited about something that will happen long after all of our existing
bodies have thrown in the towel. But we
need to start making plans for how our technology can be saved and then be able
to accelerate the growth rate of the survivors (not unlike the Sumerian Tablets). The tremendous experience and knowhow we have
in manufacturing needs to be transcribed to the people of high altitudes of
Tibet and South America so they can educate the new surviving civilizations
more quickly, not terribly different from what has actually happened with those
cultures. Our current civilization totally depends upon our
infrastructure. That will totally be
destroyed in any global disaster.
There needs to be a
tremendous shift in priority from building high rise buildings, and in
particular, any building on the coast lines. “Blessed are the meek (mtn
people?) for they shall inherit the earth”….somewhere I read about that. J
We don’t really need to
worry about the continuance of mankind.
There are people just like us all over the place and visit earth
regularly but don’t really have an incentive to make open contact with us until
we give up our nukes. A nuclear war
could so destabilize the magnetic and ionic balance that the solar system comes
unglued and starts sending huge missiles like Jupiter out towards other
civilizations. We don’t have to worry so much about them as they worry about hot
heads like us.
It would seem people of
Irish ancestry would be interested in seeing what their ancient relatives were
up to and how much effort they put in to warn us. This technology could easily have come from
someone simply more spiritually acute than we are in modern times. It does not mean aliens were the source of
this technology. After all, most of the modern
Christian people believe the Bible is the Word of God….who is to say He didn’t talk
to other folks in other ways. J
So what can the reader
do? For one thing, vote against funding
for meaningless research on whether there are aliens on Mars. Quit letting the government lie about what
they know about aliens to protect their funding for highly specialized research
into nonsense.
Jim Branson
Retired Professional
Engineering Manager
Knowhow at ctcweb dot
net
Appendix for Earth/Sun Distance Model
The astronomical unit look-alike number is derived two
different ways with the same result, exactly.
Quantum mechanics method
[(1/4-1/81)*( 1/4-1/64)*( 1/4-1/49)*( 1/4-1/36)*(
1/4-1/25)*( 1/4-1/16)*2]^(1/2) *10^(10) =
149,597,985.58693
Earth
to sun distance in kilometers (2000 epoch)
= 149,598,022.951 about 37 km
difference which cannot be measured
Ancient Egyptian method
Some think 20.625 is ancient Egyptian cubit in inches. That divided by 12 gives 1.71875 feet which
is middle A on the piano when doubled 8 times to 440 cps.
(20625/144)^(1/2)
/ 8 = 1.4959798558693 obvious the same number as the quantum mechanics
number but derived a totally different method. This is the method used in the
Mathcad solution.
A lot of the work for this analysis was done just after the
2000 epoch was defined and so the above material is correct for the time. But in the current era (2015) the
astronomical unit is defined at 149,597,870.7.
In just a few years, the simple number has gone from being slightly too
small to being slightly too high. Obviously, the earth to sun distance changes
with different planet configurations. It sure sounds like the earth/sun
distance is not a random number.
Appendix for Obliquity
Model
Obliquity
The plot below from A.L. Berger on Wikipedia is
for the earth axis tilt for the previous 5 million years. One can see the highest peaks run about 24.5
degrees and the lowest about 22.1 for a difference of 2.4 degrees. It is too
bad Prof Berger didn’t plot this at a little larger scale. But at the end of this plot and his other
plot for the next 1,000,000 years one can see his standard in the year 1850 AD
is as marked with a red diamond.

This last calculation by Berger is not a complex calculation
with a computer and is probably fairly accurate. Berger further mentions that Mercury, Venus
and Mars show somewhat similar variations in their axis.
If you had been in the Newgrange tunnel towards the back in
most of December 1680, just prior to the sun rising you would have been able to
see Comet 1680 and its tail. It has residual
heat of its own and doesn’t need the sun to be visible….but….it gets a lot more
visible after coming around the sun at close range. That means the outgoing Comet would be very
bright and clearly visible well into January 1681.
It seems likely that Newgrange has various spirals and other
marks that indicate where Comet 1680 is in its progression towards an earth
axis obliquity reversal. It could be that a crystal or prism located at the
cross-cut tunnel bent weak rays to almost right angles and made light on
spirals in the otherwise dark caverns. The reason for the upper chamber could
be to measure the tilt to the solar plane as the outgoing trajectory with more
precision. A modern examination of these
areas might be fruitful. Any crystal or
reflective stone would likely be stolen with the initial entering of people
unknowing of the true purpose of Newgrange. The marks on the walls probably
explain how it works with dimensionless ratios.
A useful university research program would be a precise 3-D scan of all
the marks.
Under the article in Wikipedia “axial tilt” there is a
section describing the calculation of the tilt for time periods relatively
close to the current era. Even the JPL
DE200 formula is only good for a few centuries.
The Laskar formula is thought to be accurate to +/- 10,000 years but it
fails miserably within the next 10,000 years, giving the tilt at 27
degrees. But it clearly shows the last
reversal occurred around 16 x 575.5 years prior to the 1680 appearance of Comet
1680. It also clearly shows that the
next reversal will occur around 18 x 575.5 years after 1680 or around 12039 AD.
While the purpose of the complex equations is to determine the angle of tilt,
the reversal timing might be more precise. The fact that these two pieces of
data are an even number integers of the orbital period of Comet 1680 are
suspect that there is a some type of link.
One has to imagine that for the earth to slow its huge but
slow angular change in tilt, stop and then reverse relatively suddenly, major
upheavals are likely going to be happening localized somewhere on the earth surface. It could be this period is so disruptive at
times that any advanced civilization living here would pick up and go somewhere
else if they could. If it triggers super
volcanoes like Yellowstone, it might be 1000s of years before things settle
down and become the place we have loved peacefully for the last 10,000 years.
If humans need a beautiful but challenging environment, earth may just be the
“cat’s meow”…..for a while.
Appendix for Newgrange Square Model
One key to discovering the overall plan of the Entrance
Stone is the quadrangle at the right end of the stone. The “design system” for the image below is
the angles marked in yellow. One can see
the fit is very good when the angles are 90, 80, 103.125 & 86.875. The bottom angle is 3.125 from 90. The 103.125 is 206.25 divided by 2. The number 20625 is the fundamental number
developing the precise average sun-earth distance in km discussed above. (20625)^(1/2)
100/96 = 1.495979856 where 0.96 is a key quantum number in the Balmer Series). The yellow diagonals locate the center of the
shape and that center is fundamental to making measurements to many other
centers on the stone.

A line drawn from the center of the quad to the far left end
of the stone at the left side of another quad is exactly at an azimuth of 180
degrees (fine yellow line below) and appears to be about 2 x pi feet in length,
though the camera distortion for long lengths may be significant. Short
dimensionless ratios generally cause the camera distortion to be minimal.
The stone appears to be about 97 inches in overall length
matching up with the 97 Kerbstones.
To find a more precise scale, one needs to do a trial and
error approach to see if any given assumption produces massive results and not
just one or two hits. The hydrogen Balmer Series wavelengths all fit nicely as
well as the hydrogen hyperfine frequency of 1.42040575. Once a satisfactory scale is developed, the
camera distortion can then be corrected.

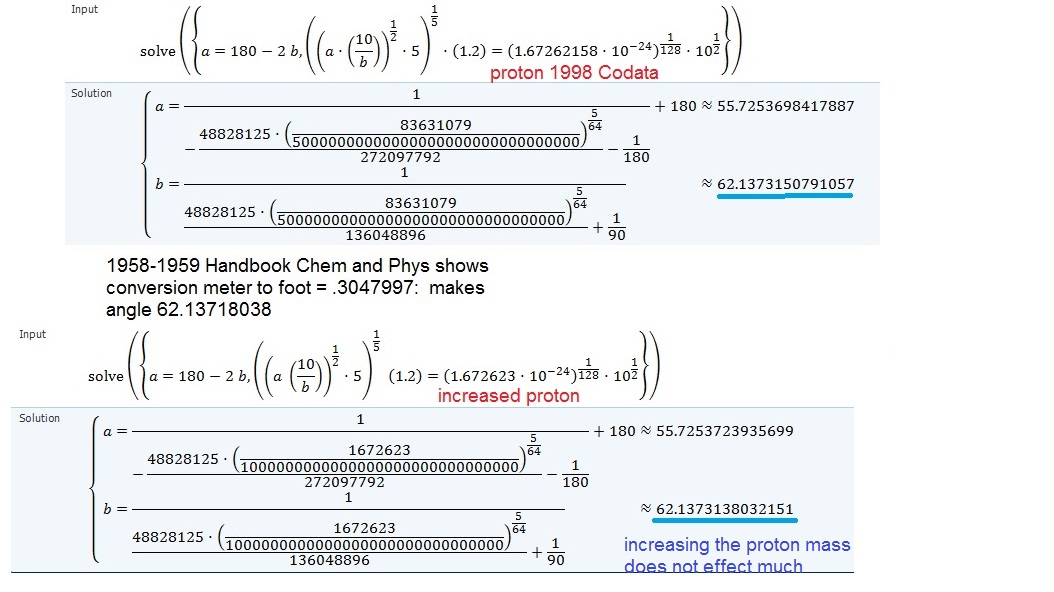
Appendix for Model of .62137 & .3047997 Conversion
Our current conversion of kilometers to miles is .621371192
and uses .3048 meter per foot by using 5280 feet per mile. The entrance stone has a yellow triangle in
the center blue concentric circles which has two isosceles angles of 62.137
each and sets up a model to calculate what the conversions ought to be and is
related to the mass of the proton.
In the MS Math calculation below, one can see it is more
precise than the original number. There are 180 degrees in a triangle, and “b”
represents the two isosceles angles of 62.137.
The angle “a” is 180 minus 2 x b and is set equal to the number
developed from the mass of the proton as done in the blog on the King Chamber
and the vertical measure of 2.0618 on Stone 56 at Stonehenge (see Stonehenge
blog). One no longer needs to measure
anything since the model is simply defined by the isosceles angles.
In the top section below, the right side is set as a
function of the proton mass for the 1998 Codata discussed further on other
blogs.
In the lower portion one can see that the original meter to
foot conversion better fits the model and maybe was the reason it was used
years ago.
While this suggests the whole purpose of the triangle was to
“demonstrate intention” the following mathematical model indicates maybe
something far more important.
The number .62137 was taken to the 128th power
and a number showed up that was discovered in the Tibetan blog and so the
following derivation of the conversions for metric to English systems was
discovered.

Perhaps this indicates that the 0.3048 conversion should be
used on calculations at Newgrange. This seems to further demonstrate that the
universe is “created” and is “designed to be self-deciphering” using our
inherited units of conversion. We ought to quit fiddling with them.
All of the data from the spiral image is developed from
serious and precise mathematics.
To do justice to this stone, one should start with better
data such as would result from a modern day 3-D scan and computer analysis of
the results. The spirals are not as easy
to locate as one might hope for but a few bits and pieces seem to help in
making more precise adjustments. The
stone is far more precise than most people can appreciate from just casually
looking at it. It is likely this stone tells a complete story of what Newgrange
is all about.
Appendix for Knowth K91 Kerbstones
The reader may think the Newgrange spiral marks are just an
accident. There are similar marks at
Knowth. The seemingly least likely mark
on the Kerbstone K-91is partially analyzed below. One might tend to think it was a mark left by
one having had too much to drink while going home from the pub. It is very faint and seemingly totally
without artistic value or anything of value.
Solid red smaller circles were drawn in the loops using the
three point circle function in ACAD. It
was noted that dozens of circles could easily be drawn at each location but
that the center of those circles did not move appreciably. Therefore, a second
generation of circles (green below and yellow above) could be drawn using the
centers of three red circles. Three of
the resulting green circles were in a line and three of the dashed yellow
circles were in a line. The azimuth of
the yellow dashed line was 3.99075 and was related to the angle between yellow
and green (2.6689117 deg) at 5^(1/4) = 1.49534, far more precise
than some accident.

The horizontal line on the bottom in dotted red goes from
the lower right circle to the lower left circle at 180 degree azimuth. Similarly above in centerline yellow a line
goes from the upper right red circle to the upper left red circle equally
precise. This is an indication that the
image does not need to be rotated to get proper orientation. The dimensionless
ratio of the upper yellow line divided by the lower red dotted line is 1.200. The trapezoid formed by the two horizontal
lines yields the universal gravitational constant 1.7202 from the dimensionless
ratio of horizontal widths and height perpendicular between them.
Since there are twelve smaller red circles and who knows how
many secondary and tertiary circles, there are hundreds of combinations which
may have relationships. Large three
point circles go thru a fourth circle indicating design intent. There are literally hundreds of angles and
azimuths that could have relationships and a very important message to anybody
who wants to develop them. The outer red circles are connected with horizontal
dotted and dashed lines quite precisely.
This image is only provided to alert others to the potential
and the mathematical analysis will not be included at this time. If the reader is not convinced by now that
these marks are not “crude artwork”, nothing will probably ever do it.
Appendix for Newgrange Output
From many different analyses, it is clear that Newgrange is
designed to monitor the light from Comet 1680, both on approach, departing and
the tail. If Comet 1680 is actually the
cause of the axial changes in the earth rotational axis, then predicting when
it will occur is of the utmost importance to people living on earth at the
time. It also might be possible that
Newgrange could initiate a resonant frequency that might initiate the
fracturing of the comet.
On the internet YouTube there are several slow motion videos
demonstrating how one can amplify the resonant frequency a champagne crystal
makes when struck with the back of the finger by say a human opera voice or an
audio synthesizer. One can see in slow
motion the crystal deforming until it finally shatters.
If one did discover the method for fracturing Comet 1680, it
would be perhaps best to do it right after the pass that halts the earth axial
shift but before the next pass sends the axial tilt in the opposite direction. We currently have the ability to predict when
the reversals will be occurring using just solar system data from JPL DE200
data. Causing the destruction of Comet
1680 would be much more complicated and maybe only known to highly-developed
spiritual knowledge.
There does not appear to be any detailed measurements taken
in the upper reaches of the chamber or the zone above the passage. However, one thing is abundantly clear from
observation alone. The long quartz
enhanced stones are set up to be stressed, in particular by bending and
compression. The piezoelectric
phenomenon is widely discussed in Wikipedia but the complexity of the chamber
design is far beyond our current ability to assess it.
The tail of Comet 1680 is likely highly ionized and at least
occasionally earth may pass thru the tail during the winter approach. From work at Stonehenge it appears trilithons
may be designed to develop charged fields and perhaps Newgrange is designed to
amplify these charges and develop an output signal emitted up thru the dirt
from the top of the chamber. It is
speculated herein that this output signal might interact with the Comet 1680
tail and be conveyed back to the body of the Comet 1680 during the winter
approach when the Comet 1680 never gets close to earth. Other large planets and perhaps larger
multiple bodies in the Kuiper Belt and Oort Cloud will rip it apart and leave
the momentum so seriously distributed that the Comet joins with the billions of
other such bodies in those zones. This
situation is so incredibly important to future generations that we cannot
afford to not examine the possibilities in the centuries to come.
It might be possible that Comet 1680 was actually sent here
by super advanced human civilizations or even a galactic federation to ease the
problems caused by the impact that did in the dinosaurs and maybe its job will
be over pretty soon. It is said that
Comet 1680 came here by passing thru a “man-made portal”. That would potentially indicate design
intent.
It is not likely that what is said herein is going to
immediately change the course of mankind, but it may find some reader who can
take it to a higher level. There is
plenty of time as long as some idiot doesn’t think “bombing Stonehenge during
WW2” was needed because it was a hazard to low flying aircraft. Humans have a way of exceeding the highest
levels of ignorance, at times.
Comments
Post a Comment